
What are the jobs of the UC Berkeley Facilities Services?

|
Facilities Services is an on-campus organization that maintains a campus environment that is suitable for teaching, learning, and research.
|

|
Goal of this Project
|
This project aims to visualize the data and tell the story behind UC Berkeley's Facilities Services. This visualization will guide you through the problems Facilities Services faces on a daily basis.
|
Why hasn't my request been fulfilled yet?

|
Berkeley Facilities Services receives a high volume of time-intensive work order requests. With 40,000+ people on campus, all of these orders need to be completed to ensure a high standard of experience with the facilities.
|

|
|
|

Work Order Requests per Day
45+
|

Average Days Spent per Work Order
Where is the work being allocated?

|
While the UC Berkeley Facilities Services strives to complete your order in the shortest amount of time, they also have constraints. Given their limited resources, the Facilities Services Department must allocate their labor and resources carefully to make sure everyone’s issues are attended to in due time.
|

|
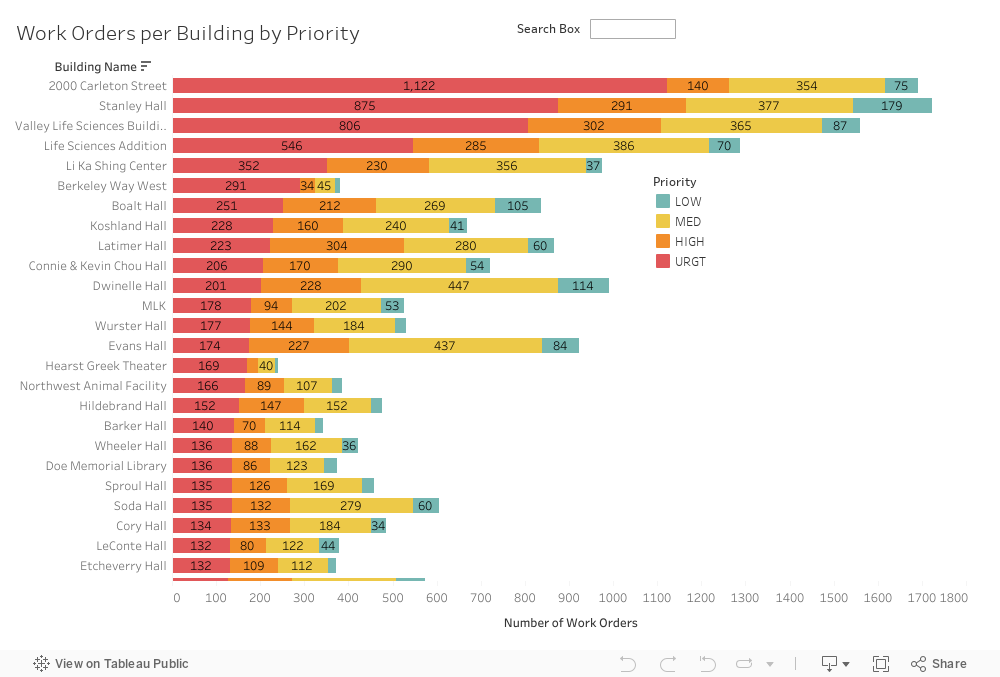 |

Here you can see that certain buildings require more urgent and high priority work orders that must be attended to immediately, while other buildings have less urgent matters that can be attended to later. The Facilities Services aims to ensure that all work orders are completed in due time, and sometimes that requires allocating labor/resources to other buildings depending on level of urgency.

|
How long can I expect my work order to take?

|
This is the array of work orders that the Facilities Services has to deal with. Depending on the work order, there are different average completion times; naturally, some work orders take longer than others. Here is a better idea of what you can expect from the UC Berkeley Facilities Services when dealing with these different issues.
|

|
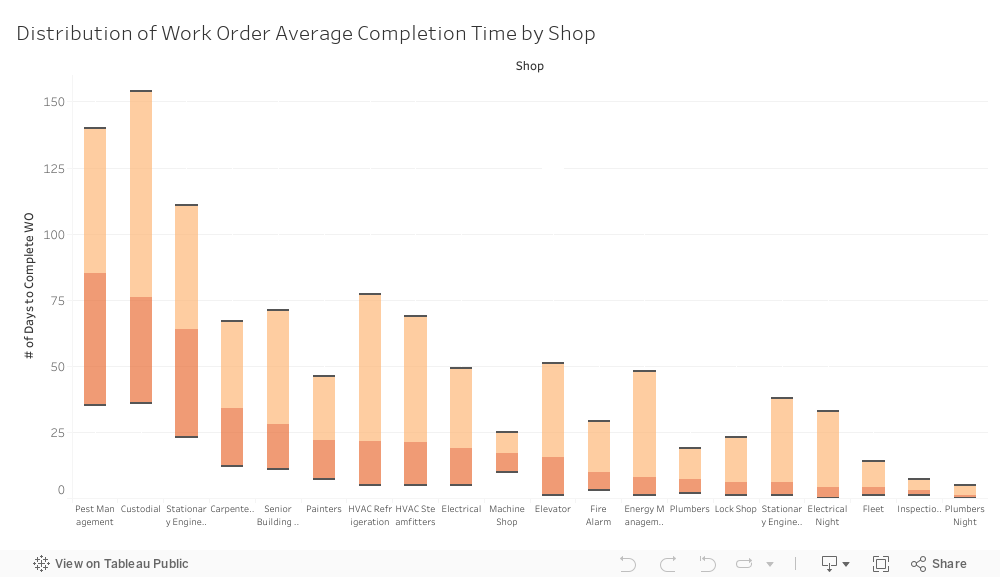
Try it yourself! Hover your mouse over the visualization above to find the statistics for each work order shop.
The black bars you see enclose the middle 50% of values. The dark orange and light orange intersect at the median for each shop.
|
Upper Hinge = 75% of values fall below this value
Lower Hinge = 25% of values fall below this value |
Upper Whisker = Highest Value
Lower Whisker = Lowest Value |

|
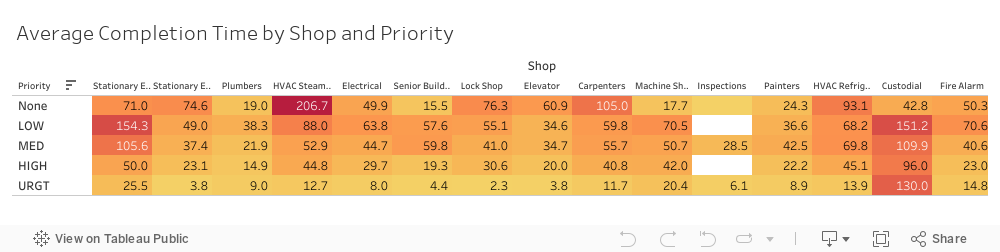
To break it down further, here is what you can expect the duration of your work order to be based on the priority it was (or was not) assigned. Naturally, some work orders have higher priority than others.
|

|
Identifying Areas of High Resource Usage
Facilities Services works on maintaining and repairing buildings across campus, but behind this are the costs, hours, and resources spent on each work order.
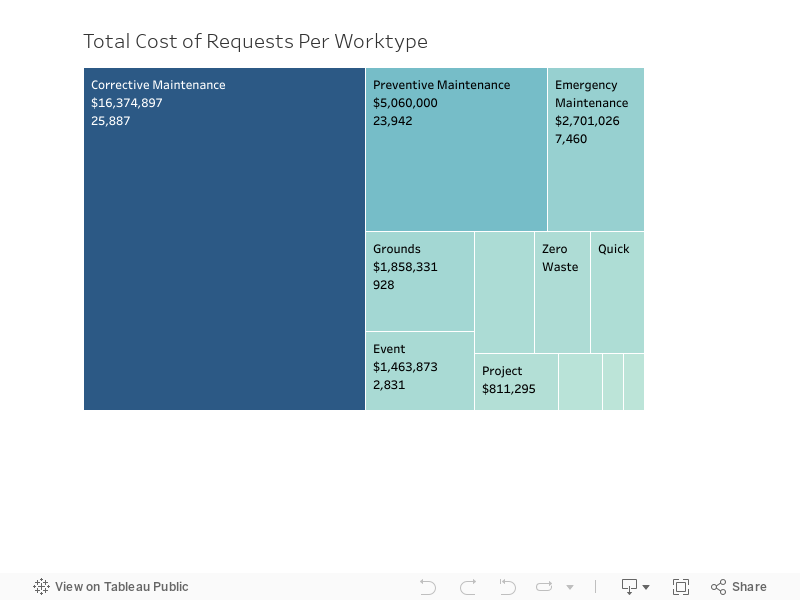
What are the most common work orders and how much money is spent on each? |

Here is an overview of how the facilities services’ expenditures are broken down, specifically by work type. It is clear that Correctional Maintenance is the highest expenditure, using about half of the total resources. Correctional Maintenance entails tasks like fixing broken facilities in buildings, such as a broken water fountain in Dwinelle. (You can also see the total number of work order requests by each work type to provide more context for the total cost.) 
|
 |
Facilities Services spends $15 million alone on the top ten
most common work orders.
Below you can see the breakdown of this cumulative figure.
most common work orders.
Below you can see the breakdown of this cumulative figure.

|
This graph shows the total cost of the top ten most common work orders. The average cost of each work order of that type is also shown.
Monetary costs of work orders cover a wide range. It is important to note that HVAC work orders are the costliest – both in terms of total cost as well as average cost per work order.
HVAC incorporates heating, ventilation, and air conditioning in various buildings across campus. In terms of the total cost of HVAC, this may incorporate fixes that must be made on heating, cooling, and ventilation units, as well as overall cost of keeping buildings at a certain temperature. 
|
|
|
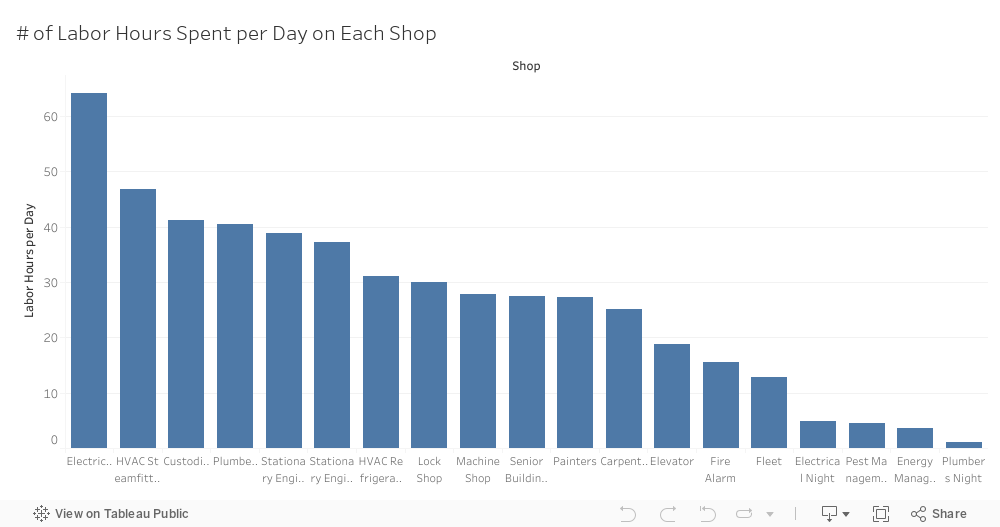
How many hours of labor are spent on
different types of work?
Looking at the number of labor hours for each type of work is another way to quantify resource use.
|
Here you can see the top twenty highest average hours of labor spent per day on different types of work category, or shop. Electrical work is clearly the highest, at about 64 total hours per workday.

|
 |
MORE QUESTIONS ABOUT THE FACILITIES SERVICES?
Visit our website here for more info on what we do to ensure your work orders are done on time.
Have more questions? Contact Us.
Have more questions? Contact Us.
